Financial Sales Report
Use this report for consolidated financial sales analysis over custom periods.
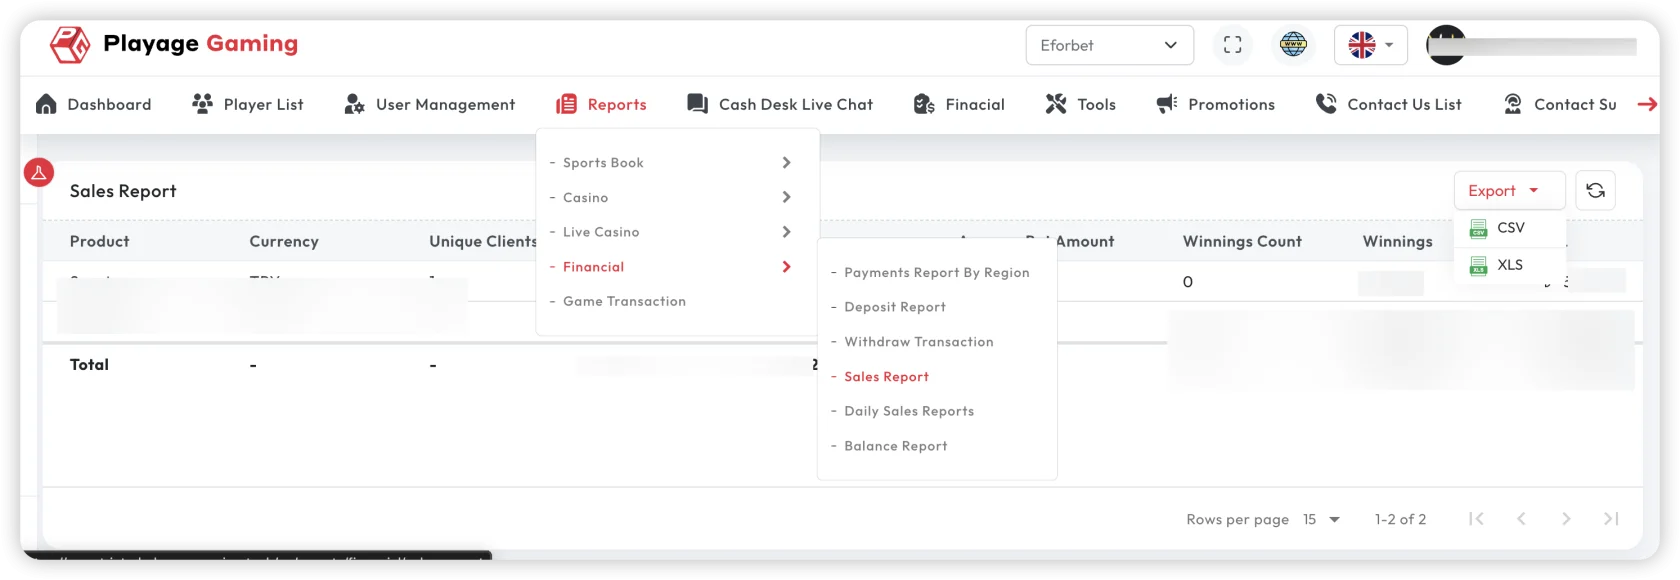
Interface Reference
Purpose
- Analyze revenue contribution by channel/product.
- Compare sales trends against deposits and withdrawals.
- Support finance planning and executive reporting.
Steps
- Open Financial Reports > Financial Sales Report.
- Select period, currency, and channel/provider filters.
- Review revenue totals and trend lines.
- Compare with previous period (WoW/MoM).
- Export final view for finance deck.
Key Metrics
- Gross sales/revenue
- Net sales contribution
- Channel/provider split
- Period-over-period change (%)
Analysis Tips
- Always compare equivalent periods (same weekdays or month length).
- Correlate sharp sales movements with campaigns and payment events.
- Use both amount and count metrics; amount alone can hide conversion shifts.
Troubleshooting
- Trend looks inconsistent: check currency and timezone settings.
- Gap vs daily report: confirm cut-off timing.
- Unexpected negative movement: inspect rollback/refund effects.
Best Practice
Use this report as your primary weekly and monthly finance baseline.