Dashboard Overview
The CRM Dashboard is the default landing page for high-level CRM performance tracking. It combines date-based KPI cards, relationship summary metrics, and a trend chart for new-customer movement.
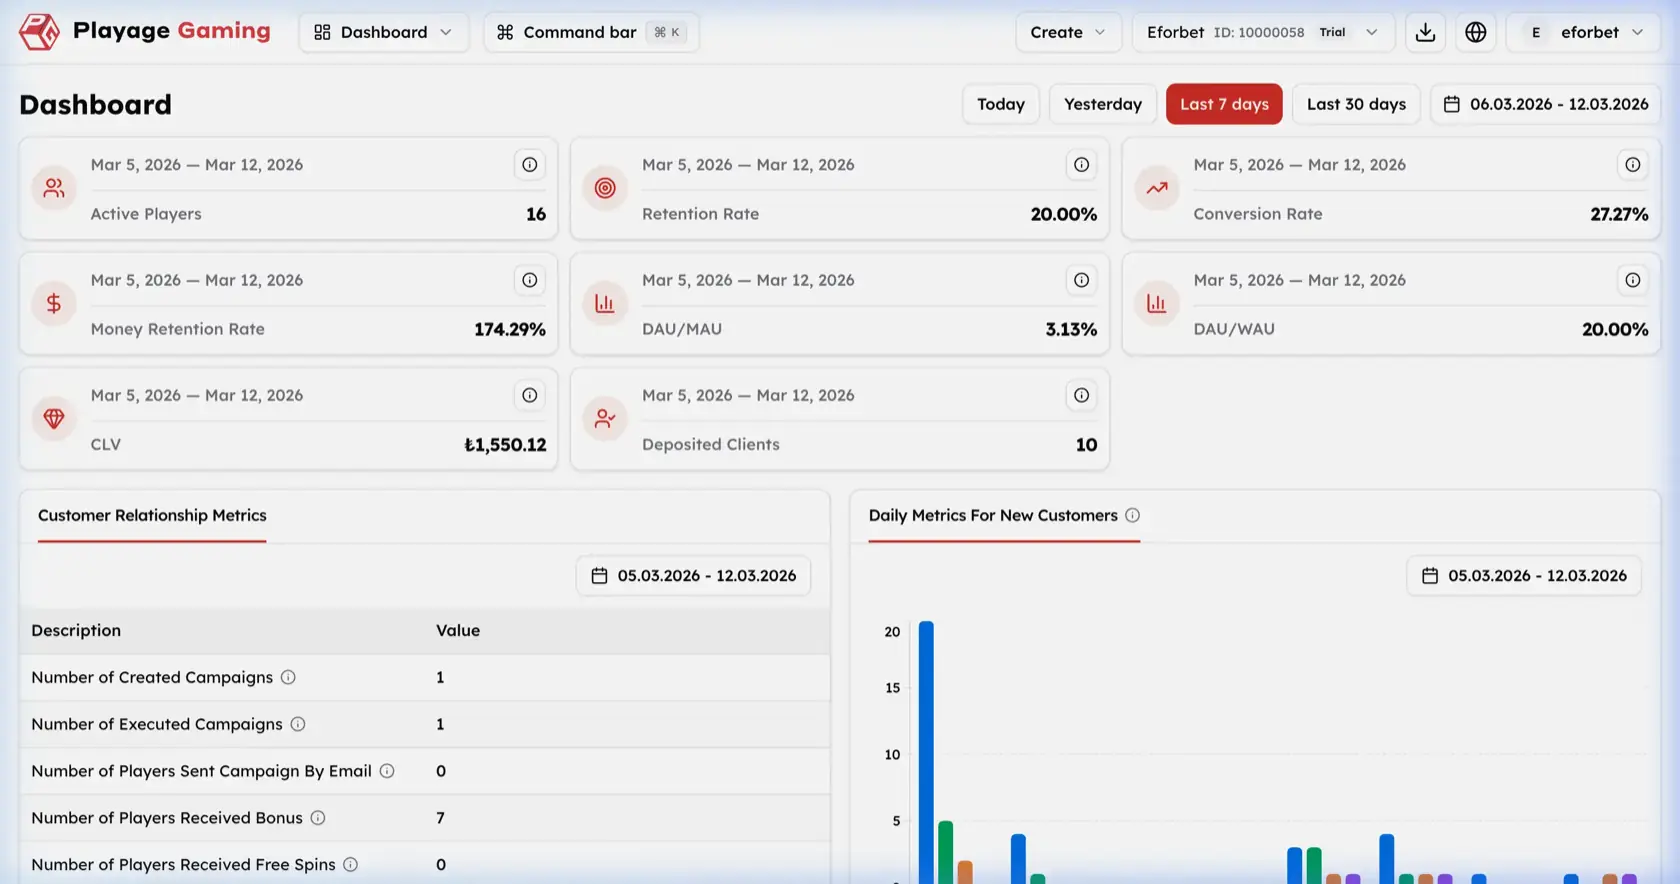
What You Monitor Here
- Top-level CRM KPIs for the selected period
- Customer relationship metrics
- Daily trend chart for new customers
- Active project context from the top project selector
- Quick date presets and custom date range controls
Interface Overview
Visible controls in the screenshot:
- Date presets:
Today,Yesterday,Last 7 days,Last 30 days - Custom date range picker
- KPI cards in a grid layout
Customer Relationship MetricstableDaily Metrics For New Customerschart
KPI Cards
| Metric | Meaning |
|---|---|
| Active Players | Unique active players in the selected period |
| Retention Rate | Percentage of returning users |
| Conversion Rate | Share of users who completed the intended conversion action |
| Money Retention Rate | Retention level for deposited or monetized value |
| DAU/MAU | Daily active users compared with monthly active users |
| DAU/WAU | Daily active users compared with weekly active users |
| CLV | Customer lifetime value summary |
| Deposited Clients | Number of users with successful deposits |
Step-by-Step: Review Dashboard Metrics
- Open
Dashboardin CRM. - Confirm the correct project from the top project selector.
- Choose a quick preset such as
TodayorLast 7 days, or use the custom date range. - Review KPI cards row by row.
- Compare retention, conversion, and deposit-oriented metrics together.
- Move to
Customer Relationship Metricsfor campaign output counts. - Review
Daily Metrics For New Customersto understand trend direction.
Customer Relationship Metrics
The table shown in the screenshot summarizes campaign-related output counts for the selected period.
| Row | Meaning |
|---|---|
| Number of Created Campaigns | Campaigns created in the selected range |
| Number of Executed Campaigns | Campaigns that actually ran |
| Number of Players Sent Campaign By Email | Users reached through email |
| Number of Players Received Bonus | Users who received a bonus |
| Number of Players Received Free Spins | Users who received free spins |
New Customer Trend Chart
The chart visualizes daily movement for new-customer-related metrics across the selected period. Use it to spot spikes, drops, and period-to-period changes rather than relying only on summary counts.
Recommended Review Order
- Set the period first.
- Review KPI cards.
- Compare CRM output metrics.
- Check trend movement in the chart.
- Drill into campaign, segment, or report pages if the dashboard shows anomalies.